


Caste/Ethnic Representation in His Majesty’s Government at policy level in Nepal
Dr. Ram Prakash Yadav
June 14, 2006
The purpose of this paper is to analyze the caste/ethnic representation in the Cabinet and high policy and decision making levels of His Majesty’s Government to find out the degree of participation of different ethnic/caste groups in the council of ministers and major policy making bodies in the government after the political change from the feudal autocratic regime of Rana government in the country in 1951. This paper mainly presents the data related to the magnitude of representation but does not investigate the causes for such high disproportionate representation.
The analysis of Caste/Ethnic representation in His Majesty’s Government is divided into three parts. The first part deals with their representation in the Cabinet (council of ministers). The second part deals with the representation in the National Planning Commission, and the third part deals with the representation in important civil service institutions of the government.
For the purpose of this study the ethnic/caste groups are identified into six broad groups. They are Hill Brahmins, Chhetri/Thakuri, Newar, Tarai (Madhesi), Hill Social groups (ethnic and dalit) and others (remaining).
(A) Castes/Ethnic Representation in Cabinet (council of ministers) of Nepal
The governance in Nepal after the fall of Rana regime in 1951 has been mainly in the hands of Chhetri/Thakuri, Brahmans and Newars. This is clearly observed by the analysis of the data on the Council of Ministers (cabinet) formed after 1951 in Nepal. From 1951 until January 31, 2005, cabinet was formed sixty-four times. On February 1st, 2005, King Gyanendra formed cabinet under his chairmanship and instead of a prime Minister; two deputy chair-men were appointed in the cabinet. So far seventeen persons have been the prime ministers in different times during this period (Annex 1.)
The period of analysis is from 1951 until present i.e. April, 2006. This period is divided into following five periods.
February 1951 to 1959 - Post Rana, King Tribhuwan and King Mahendra’s Rule
May1959 to December 1960 - Democratic Government of Nepali Congress
December 1960 to 1990 - Panchayat Period
1990 to 2002 - Democratic Government
2002 to April, 2006 - Government under 127 Act of Constitution under the King.
Over the period between 1951 to April, 2006, the representation of various caste/ethnic groups in Cabinet from 1951 to Present is shown in the table 1
Table 1: Representation of various caste and Ethnic groups in Cabinet from 1951 to 2005.
Cabinet
No. of Ministers.
Percent
Brahmins 360 26.8 12.7 2.11
Chhetri/Thakuri 378 28.2 17.3 1.63
Newar 136 10.1 5.5 1.84
Brahmins/Chheti/Newar 874 65.2 35.5 1.84
Tarai (Madheshi) 205 15.3 33.0 0.46
Hill Social Groups 234 17.4 29.0 0.60
Others 28 2.1 2.5 0.84
Tarai/HSG/Others 467 34.8 64.5 0.54
TOTAL 1341 100.0 100.0
The table above indicates that the Hill Brahmins which constituted only 12.7 percent of population in Nepal have dominated in the representation in the Council of Ministers (Cabinet) over more than fifty five years during the period of 1951 to 2006, by the factor of 2.11. The next highest group is of Newar which constituted only 5.5 percent of the total population, but occupied 10.1 percent of ministerial seats in the cabinet and their participation in governance in relation to the population are represented by the factor of 1.84. This is followed by Chhetri/Thakuri group whose proportional share index is 1.63, though they constituted the highest percent in the total number of the ministers until now. When combined these three castes together represented by the factor of 1.84 where as the remaining groups (other than Brahmins, Chhetri and Newar) were represented by the factor of 0.54 only. The proportional share index is calculated by dividing the percent share of a caste in the cabinet with the percent of the total population under that caste.
The above three castes which constitute only 35 percent of the total population in the country have occupied 65 percent of ministerial posts while only less than 35 percent of ministerial posts have been occupied by remaining 65 percent of the population in the country. The Hill social groups which constitute 29 percent of population occupied only 17.4 percent of ministerial posts, and their participation in governance in relation to their proportion in the population is represented by the factor of 0.6 only. Similarly Madheshi of Tarai which constitutes 33 percent of population occupied only 15.3 percent of ministerial posts, and their participation in relation to their proportion on population is the lowest over the period of 55 years as represented by the factor of 0.46 only.
King’s Government vs. Democratic Government
As this period is separated into two groups namely King’s rule and Democratic rule, the following picture emerges as shown in Table 1 below.
King’s rule covers the periods of (i) 1951 to 1959 (ii) 1960 to 1990 &(iii) 2002 to April,2006 Democratic rule covers the periods of (i) 1959 to 1960 and (ii) 1990 to 2002
Table 2: Representation of various castes and Ethnic groups in Cabinet during the period of King’s Government and Democratic Government
King’s Government
Democratic Government
No. % PSI No. % PSI
Brahman 187 21.9 1.72 173 35.6 2.80 12.7
Chhetri 264 30.9 1.79 114 23.5 1.36 17.3
Newar 101 11.8 2.15 35 7.2 1.31 5.5
Total 552 64.6 1.82 322 66.3 1.87 35.5
Madhesi 113 13.2 0.40 92 18.9 0.57 33.0
HSG 170 19.9 0.69 64 13.2 0.46 29.0
Others 20 2.3 0.92 8 1.5 0.60 2.5
Total 303 35.4 00 164 33.6 0.52 64.5
G. Total 855 100 486 100.0 100.0
The Table 2 indicates some significant contrast in the representation of different castes/ethnic groups in the cabinet. Among the three main contenders in the cabinet, King’s rule indicates the dominance of Chhetri/Thakuri and Newar more than the Brahmins, while the Democratic rule indicates the dominance of Brahmins more than the Chhetri and Newar in the cabinet. The representation of Brahmins in the cabinet during Democratic rule is 35.6 percent while it is only 21.9 percent during King’s rule, constituting the proportional share index of 2.80 and 1.72 respectively. On the other hand, the representation of Chhetri/Thakuri in the cabinet during King’s rule is 30.9 percent while it is only 23.5 percent during democratic rule constituting the proportional share index of 1.79 and 1.36 respectively.
The Newar group which constituted only 5.5 percent of population occupied 11.8 percent of ministerial posts in the cabinets of King’s rule constituting the highest proportional share index of 2.15 compared to only 7.2 percent during Democratic rule constituting the lowest proportional share index of 1.31 among the three contenders. It is important to note that the dominance of the trinity of Brahmins, Chhetri and Newar further increased during Democratic Rule (of the proportional share index of 1.87) than the King’s rule (of the proportional share index of 1.82) instead of broadening by the inclusions of other excluded groups as expected by the common people.
Another significant finding is the contrasting situation of participation of Madhesi and Hill Social groups during these two different regimes, though both are disproportionately represented less in the cabinet as compared to the three privileged castes of Brahmins, Chhetri and Newars. The representation of Madhesi during King’s rule is less than the Democratic rule while the representation of Hill social group is reverses i.e. more during king’s rule than the democratic rule. Overall, the democratic rule has favored the representation of Brahmins and Madhesi in contrast to the King’s rule which had favored Chhetri/Thakuri, Newar and Hill social groups.
Authorities or power of Madhesi and HSGs Ministers
The above analysis is carried out in terms of representation in the cabinet entirely in terms of numbers (quantity). But this misses the level of power or authority in the cabinet. So a further analysis is made to examine this aspect by further disaggregating the ministers into three categories i.e. Full Ministers, State Ministers and Assistant Ministers. Full Minister is called Minister and therefore the designations are Ministers, State Ministers and Assistant Ministers. Generally Ministers and State Ministers are assigned full portfolio of a ministry or more than one ministry while the assistant ministers are merely to assist the Ministers or State Ministers. The Minister or State Minister may delegate certain power to assistant ministers. This analysis is made only for Madhesi and HSGs during the period of Panchayat regime (1960-1990) and the period of parliamentary democracy (1990-2002) to find out their participation in terms of their power or authority. The findings are presented in the Table 3.
Table 3: Representation in terms of Ministers, State Ministers and Assistant Minister for Madhesi and HSGs during Panchayat and Democratic regimes
Types of Ministers Panchayat Regime Democratic Regime
Madhesi
No. % HSGs
No. % M & HSGs
No. % Madhesi
No. % HSGs
No. % M & HSGs
No. %
Ministers 33 38.8 31 19.4 64 26.1 42 50.0 30 55.6 72 52.2
State Ministers 20 23.5 31 19.4 51 20.8 20 23.8 15 27.8 35 25.4
Assist. Ministers 32 37.6 98 61.2 130 53.1 22 26.2 9 16.6 31 22.4
Total 85 100.0 160 100.0 245 100.0 84 100.0 54 100.0 138 100.0
The disaggregated level of information on ministers indicates that Madhesi and HSGs combined accounted for only 47 % as Ministers and State Ministers of their total number in the cabinet during Panchayat period as compared to 77.6 percent of their total number in the cabinet during Democratic Regime. Conversely, Assist ministers accounted for 53% during Panchayat as compared to only 22.4 % during Democratic regime. This clearly indicates that Madhesi and HSG combined were not only discriminated in terms of their representation in quantity terms but also were highly discriminated in terms of portfolio assignment to them as far as power or authority in the cabinet is concerned. Thus naturally they played limited role at the policy making level in the cabinet.
Now, in comparing between Madhesi and HSG, one finds that the percentage of minister and state minister in Madhesi constituted 62.3 % while HSG accounted for only 38.8% during Panchayat. Conversely, the percentage of assistant minister from Madhesi group constituted 37.6 % while the HSG accounted for 61.2% during Panchayat. Thus while HSG seems to have received favor in absolute number during Panchayat time, but their access to authority or power was low. On the other hand during Democratic regime, greater number of HSG were assigned to full portfolio of ministries while their participation in terms of number is less than those of Panchayat period.
Generally, finance and home ministry are considered powerful ministries. As one analyses the whole period from 1951 to 2005, no one so far had been appointed finance minister either from Madhesi community or from Hill Social Groups as shown below. In case of Home ministry during the entire period only one Madhesi (Mr. Vedananda Jha) was appointed as home minister and only two persons from HSG (Mr. Padma Sunder Lawati and Budhiman Tamang) were appointed home ministers.
Women Representation in Cabinet.
Women representation in the cabinet is very limited. Of a total of 1302 ministers there had been only 25 women ministers (includes full, state and assistant, most of them were with the rank of assistant minister) over the period of last 55 years (names in annex 8 ) .Among those 25 persons, some have become minister many times. As we take into account of the reappointment of the same person there had been 44 ministers over this period. Among those 44 ministers 20 were Brahmans, 15 were Chhetri, 3 were from Newar community, 1 from Madhesi and 5 from Hill Social Group. It is interesting to note that there was higher representation from Chhetri in the King’s government while there was greater number of Brahmans during the democratic period. There were no representation from Madhesi and HSG in the democratic governments.. In terms of proportional share index, Bhrahmin women have been dominating in their representation among women. This analysis clearly indicates while the representation of women in the cabinet overall is extremely low i.e. only 3.3% , of which 80.6 percent is represented by Brahmins and Chhetri women which constitute only 30 percent of the population and the rest 19.4 percent is represented by Newar, Madhesi, HSG and others which constitute 70 percent of the population in the country. No women has so far occupied the position of Prime Minister, Finance Minister, Home Minister, Vice-Chairman of NPC, Chief Secretary, Governor of the Central Bank, and Finance Secretary as yet. In just recent years, two women professionals have been appointed as members of the National Planning Commission.
Table 4: Representation of women (Various Castes and Ethnic Groups) as Minister, State Minister and Assistant Minister during the Periods from 1951 to 2005.
King’s Government
Democratic Government Total (1951-2006))
No. % PSI No. % PSI No. %
Brahman 4 16.0 1.26 16 84.2 6.63 20 45.5 12.7 3. 66
Chhetri 13 52.0 3.00 2 10.5 0.61 15 34.1 17.3 1.97
Newar 2 8.0 1.45 1 5.3 0.96 3 6.8 5.5 1.24
Total 19 76.0 2.14 19 100.0 2.82 38 86.4 35.5 2.43
Madhesi 1 4.0 0.12 0 0.0 0.0 1 2.3 33.0 0.07
HSG 5 20.0 0.69 0 0.0 0.0 5 11.3 29.0 0.39
Others 0 0.0 0.0 0 0.0 0.0 0 0.0 2.5 0.0
Total 6 24.0 0.37 0 0.0 0.0 6 13.6 64.5 0.21
G. Total 25 100.0 19 100.0 44 100.0 100.0
Finance Minister
As far as the major resource allocation is concerned, the finance minister plays very important role in the government and he is one of the most powerful ministers as far as financial resource mobilization and distribution is concerned. So the analysis here has also included the minister of finance. Over the period between 1951 and 2005, there had been 25 persons who have become finance minister of Nepal. Among those 25 persons, some have become finance minister many times. As we take into account of the reappointment of the same person there had been 38 finance ministers over this period. Among those 38 ministers 16 were Brahmans, 15 were Chhetri and 7 were from Newar community. No body from Madhesi and Hill Social Group has yet become finance minister of Nepal as shown in table 5. It is interesting to note that during the democratic period there was no representation from Newar community as minister of finance in the cabinet. In terms of proportional share index, Newar has been dominating in its representation at the finance minister level.
Table 5: Representation of Various Castes and Ethnic Groups as Finance Minister during the Periods from 1951 to 2005.
King’s Government
Democratic Goverment Total (1951-2006))
No. % PSI No. % PSI No. %
Brahman 7 29.2 2.30 9 64.3 5.06 16 42.1 12.7 3. 31
Chhetri 11 45.8 2.65 5 35.7 2.06 16 42.1 17.3 2.43
Newar 6 25.0 4.55 0 0.0 0.0 6 15.8 5.5 2.87
Total 24 100.0 2.82 14 100.0 2.82 38 100.0 35.5 2.82
Madhesi 0 0.0 0.0 0 0.0 0.0 0 0.0 33.0 0.0
HSG 0 0.0 0.0 0 0.0 0.0 0 0.0 29.0 0.0
Others 0 0.0 0.0 0 0.0 0.0 0 0.0 2.5 0.0
Total 0 0.0 00 0 0.0 0.0 0 0.0 64.5 0.0
G. Total 24 100.0 14 100.0 38 100.0 100.0
Thus the above analysis gives a bird’s eye view of ethnic representation in the governance at the ministerial level over the period from 1951 to 2005.
Home Minister
Home minister is responsible for law and order in the country. The police force and the chief district officers in 75 districts of the country are under the home Ministry. Thus home minister influences in decisions relating to the governance and administration in the country. The home minister occupies very important and high position in the cabinet. Over the period between 1951 and 2006 there had been 52 home ministers in the country. Among those 52 ministers 19 were Brahmans, 23 were Chhetri, 7 were from Newar community, 1 from Madhesi and 2 from Hill Social Groups as shown in the table 6. It is important to note that during the democratic government there was no representation from Newar and Madhesi Community as home minister in the cabinet.. In terms of proportional share index, Brahmin has been dominating in its representation at the home ministry over last 55 years of rule. However there had been highest percent of representation from Chhetri during King’s government but Brahmins have dominated in representation during Democratic government. The representation from Madhesi and hill social groups has been negligible.
Table 6: Representation of Various Castes and Ethnic Groups as Home Minister during the Periods from 1951 to 2006.
King’s Government
Democratic Government Total (1951-2006))
No. % PSI No. % PSI No. %
Brahman 11 29.0 2.28 8 57.2 4.50 19 36.5 12.7 2.87
Chhetri 18 47.4 2.74 5 35.7 2.06 23 44.2 17.3 2.55
Newar 7 18.4 3.35 0 0.0 0.0 7 13.5 5.5 2.45
Total 36 94.8 2.67 13 92.9 2.62 49 94.2 35.5 2.65
Madhesi 1 2.6 0.79 0 0.0 0.0 1 1.9 33.0 0.06
HSG 1 2.6 0.90 1 7.1 0.25 2 3.8 29.0 0.13
Others 0 0.0 0.0 0 0.0 0.0 0 0.0 2.5 0.0
Total 2 5.2 0.08 0 0.0 0.0 3 0.0 64.5 0.0
G. Total 38 100.0 14 100.0 52 100.0 100.0
(B) Representation in National Planning Commission
The first time the Planning Commission was established in the year 1957 (B.S.2013) at central level with 24 members under the chairmanship of the prime minister Tanka Prasad Acharya. This acted mostly as an advisory body to the government. In 1958 (B.S.2014) Planning Council was established under the chairmanship of His Royal Highness Prince Himalaya Bir Bikram Shah Deva. Later, in 1969 (B.S. 2016), during the parliamentary government of BP Koirala, a high level Planning Board was formed under the Chairmanship of the Prime Minister Koirala. Again after the dissolution of the Parliamentary government by late King Mahendra in 1961 (B.S. 2017), King reformulated the Planning Board into National Planning Commission under his own chairmanship. In the year 1963 (B.S.2019), King handed over the Chairmanship to the Chairman of the Council of Minister Dr. Tulsi Giri and subsequently in the year1969 (B.S. 2025), the Prime Minister assumed the Chairmanship of NPC. Since then NPC has always been chaired by the Prime Minister. The table below indicates the representation of the various Castes and Ethnic Groups in NPC as Members during King’s government including Panchayat period and Democratic government after 1990.
Table 7: Representation of Various Castes and Ethnic Groups as Members in NPC during the Periods of King’s Rule and Democratic Rule
King’s Government
Democratic Government Total (19 58-2005)
No. % PSI No. % PSI No. %
Brahman 30 28.6 2.25 43 53.7 4.23 73 39.5 12.7 3.11
Chhetri 24 22.8 1.32 11 13.8 0.80 35 18.9 17.3 1.09
Newar 36 34.3 6.24 20 25.0 4.55 56 30.3 5.5 5.51
Total 90 85.7 2.41 74 92.5 2.61 164 88.7 35.5 2.50
Terai 8 7.6 0.23 6 7.5 0.23 14 7.6 33.0 0.23
HSG 5 4.8 0.17 0 0.0 0.0 5 2.7 29.0 0.09
Others 2 1.9 0.76 0 0.0 0.0 2 1.0 2.5 0.04
Total 15 14.3 0.22 6 7.5 0.12 21 11.3 64.5 0.18
G. Total 105 100.0 80 100.0 185 100.0 100.0
The above table indicates that over the period from 1958 (B.S. 2014) to 2005 (B.S. 2061), there had been 185 members including chairmen and member secretaries in the NPC. Overall, Brahman, Chhetri and Newar (BCN) dominated in the representation, constituting altogether 88.7 percent while Madhesi from Tarai, Hill Social Groups from the hills and Mountains and others together represented only 11.3 percent of the total members. The proportional share index of BCN is 2.5 while that of remaining groups is only 0.18. In BCN group, the proportional share index of Newar is the highest i.e. 5.5 followed by Brahman with 3.1 and Chhetri with 1.1. Similarly the proportional share index of Madhesi is 0.23 followed by HSG with .09 only. This clearly indicates a very insignificant representation of Madhesi and HSGs in the decision making level at NPC which is largely dominated by the representation of BCN group.
During both the periods of King’s rule and Democratic rule the overall dominance of BCN group remain about the same as the entire period with even higher representation of this group during Democratic period. The representation of Brahman caste significantly increased during the Democratic period while Chhetri’s representation declined as compared to the Panchayat period.
Prime Minister and the Chairman of National Planning Commission
The Chairman of the National Planning Commission has been the Prime Minister of Nepal. So far from 1951 until present, there had been 35 heads of the cabinet who have assumed the role of prime minister of Nepal. Among those 35, some have become prime minister many times. Among those 35 persons, 14 were Brahman, 19 were Chhetri and 2 were from Newar community. There had been nobody from Madhesi and Hill Social Group as yet to become Prime Minister of Nepal. In terms of proportional share index, Brahman and Chhetri have been dominating in their representation at the prime minister level. As the total period is divided into the period of King’s government and Democratic government, one finds that King’s government is dominated by Chhetri while the Democratic government is dominated by Brahmins.
Table 8: Representation of Various Castes and Ethnic Groups as Prime Minister and the Chairman of NPC during the Periods from 1951 to 2006.
King’s Government
Democratic Goverment Total (1951-2006))
No. % PSI No. % PSI No. %
Brahman 7 29.2 2.30 7 63.6 5.01 14 40.0 12.7 3.15
Chhetri 15 62.5 3.61 4 36.4 2.10 19 54.3 17.3 3.14
Newar 2 8.3 1.51 0 0.0 0.0 2 5.7 5.5 1.04
Total 24 100.0 2.82 11 100.0 2.82 35 100.0 35.5 2.82
Madhesi 0 0.0 0.0 0 0.0 0.0 0 0.0 33.0 0.0
HSG 0 0.0 0.0 0 0.0 0.0 0 0.0 29.0 0.0
Others 0 0.0 0.0 0 0.0 0.0 0 0.0 2.5 0.0
Total 0 0.0 00 0 0.0 0.0 0 0.0 64.5 0.0
G. Total 24 100.0 11 100.0 35 100.0 100.0
(b) Vice-Chairman of NPC
As far as the Vice-Chairman of NPC is concerned, over the entire period of1958 (B.S 2014) to 2006 (2062 B.S.), Brahman, Chhetri and Newar clearly overwhelmingly dominated with their representation. Of the total 22 V.Cs., Brahman, Chhetri and Newar accounted for 21 VCs while there was only one V.C (Dr. Harka Gurung) who represented from the hill social group. Among these three, the Proportional Share Index (PSI) of Newar is the highest i.e. 6.62 while Brahman and Chhetri had PSI of 2.15 and 1.84 respectively. The majority of population other than BCN had PSI only 0.07 (Table 9). There are not substantial differences in the representation of these three groups between King’s government and Democratic government. However, there had not been any representation from Madhesi and hill social groups during the democratic government in the post of Vice-chairmanship of the highest planning body NPC.
Table 9: Representation of Various Castes and Ethnic Groups as Vice-Chairman in NPC during the Periods of King’s Rule and Democratic Rule.
King’s Government
Democratic Government Total (1958-2006))
No. % PSI No. % PSI No. %
Brahman 3 27.3 2.15 3 27.3 2.15 6 27.3 12.7 2.15
Chhetri 4 36.4 2.10 3 27.3 1.58 7 31.8 17.3 1.84
Newar 3 27.3 4.96 5 45.4 8.25 8 36.4 5.5 6.62
Total 10 91.0 2.56 11 100.0 2.82 21 95.5 35.5 2.69
Madhesi 0 0.0 0.0 0 0.0 0.0 0 0.0 33.0 0.0
HSG 1 9.0 0.31 0 0.0 0.0 1 4.5 29.0 0.16
Others 0 0.0 0.0 0 0.0 0.0 0 0.0 2.5 0.0
Total 1 9.0 0.14 0 0.0 0.0 1 4.5 64.5 0.07
G. Total 11 100.0 11 100.0 22 100.0 100.0
(C) Representation in Civil Service
(a) Chief Secretary
Chief Secretary is considered to be the head of civil administration. The highest position for a civil servant is the post of Chief Secretary. The tradition of chief secretary started in 1967 (B.S. year of 2023). Mr. Kul Shekhar Sharma was the Cabinet Secretary to be appointed as the first Chief Secretary in the government in 1967. However there were three other cabinet secretaries before him started with Sardar Sri Gunjaman Singh in 1951 (B.S.2007). Including these three cabinet secretaries there had been so far 19 chief secretaries from the year 1951 to 2006 (see Annex 6). Table 10 presents the representation of various Castes and Ethnic groups as Chief Secretary in the government.
Table 10: Representation of Various Castes and Ethnic Groups as Chief Secretaries in HMG during the Periods of King’s Rule and Democratic Rule
King’s Government Democratic Government Total (2014-2061)
No. % No. % No. %
Brahman 2 16.7 3 42.9 5 26.3 12.7 2.07
Chhetri 6 50.0 0 0.0 6 31.6 17.3 1.83
Newar 4 33.3 4 57.1 8 42.1 5.5 7.65
Total 12 100.0 7 100.0 19 100.0 35.5 2.82
Terai 0 0.0 0 0 0 0.0 33.0 0.0
HSG 0 0.0 0 0 0 0.0 29.0 0.0
Others 0 0.0 0 0 0 0.0 2.5 0.0
Total 0 0.0 0 0 0 0.0 64.5 0.0
G. Total 12 100.0 7 100.0 19 100.0 100.0
The table above indicates that only Brahman, Chhetri and Newar have occupied the post of Chief Secretary over the period of 55 years (1951 to 2005). Newar has dominated in their representation as indicated by the proportion share index of 7.65 while the Brahman and Chhetri have PSI around 2. There has not been any body from Madhesi and Hill Social Groups in the post of Chief Secretary over this period. In other words, there has not been a single representation to the post of the Chief Secretary from about 65 percent of population over the period of 55 year in Nepal.
(b) Finance Secretary
Finance Secretary occupies very powerful position in the government in dealing with fiscal as well as monetary policies. He represents HMG in negotiating financial matters with donors and also represents government in policy making meetings of the World Bank, International Monetary Fund and the Asian Development Bank. Thus he holds tremendous power in the government in terms of allocation of resources.
Table 11: Representation of Various Castes and Ethnic Groups as Finance Secretary in HMG during the Periods of King’s Rule and Democratic Rule
King’s Government Democratic Government Total (1951-2005)
No. % No. % No. %
Brahman 3 25.0 4 80.0 7 41.2 12.7 3.24
Chhetri 4 33.3 0 0.0 4 23.5 17.3 1.36
Newar 5 41.7 1 20.0 6 35.3 5.5 6.42
Total 12 100.0 5 100.0 17 100.0 35.5 2.82
Terai 0 0.0 0 0 0 0.0 33.0 0.0
HSG 0 0.0 0 0 0 0.0 29.0 0.0
Others 0 0.0 0 0 0 0.0 2.5 0.0
Total 0 0.0 0 0 0 0.0 64.5 0.0
G. Total 12 100.0 5 100.0 17 100.0 100.0
The table above indicates that only Brahman, Chhetri and Newar have occupied the post of Finance Secretary over the period of 55 years (1951 to 2005). Newar has dominated in their representation as indicated by the proportion share index of 6.42 while the Brahman and Chhetri have PSI 3.24 and 1.36 respectively. Brahman has dominated during the Democratic government. There has not been any body from Madhesi and Hill Social Groups in the post of Finance Secretary over this period. In other words, there has not been a single representation to the post of the Finance Secretary from about 65 percent of population over the period of 55 year in Nepal.
(c) Governor of the Central Bank (Nepal Rastra Bank)
Governor of the Central Bank is the head of monetary policy making institution of Nepal. Naturally the representation of certain caste/ethnic group is important. The Central Bank was established in 1956 (on Falgun 26, 2012 B.S). There had been so far 13 Governors from the year 1956 to 2005 (Annex 5). Table 12 presents the representation of various Castes and Ethnic groups as Governors in the Nepal Rastra Bank.
Table 12: Representation of Various Castes and Ethnic Groups as Governors at Central Bank of HMG during the Periods of 2012 to 2062.
1956 to 2005
No. %
Brahman 5 38.45 12.7 3.03
Chhetri 5 38.45 17.3 2.22
Newar 2 15.40 5.5 2.80
Total 12 92.30 35.5 2.60
Terai 1 7.70 33.0 0.23
HSG 0 0.0 29.0 0.0
Others 0 0.0 2.5 0.0
Total 1 0.0 64.5 0.0
G. Total 13 100.0 100.0
The table above indicates that mostly Brahman, Chhetri and Newar have occupied the post of Governor of Nepal Rastra Bank over the period of 50 years (1956 to 2005). Brahman has dominated in their representation as indicated by the proportion share index of 3.03 while Newar and Chhetri have PSI 2.80 and 2.22 respectively. There has been only one person from Madhesi group (Hari Shankar Tripathi) and no representation at all from Hill Social Groups in the post of Governor of Nepal Rastra Bank over this period.
Summary
Thus over the period of almost 55 years from February 17, 1951 (Falgun 7, 2007 B.S) to April 24, 2006 (Baisakh 11, 2063), the representation at the ministerial level, the national planning commission level, important ministers and secretary levels has been dominated by Brahman, Chhetri and Newar in the country. The representation of Madhesi and Hill social groups has been disappointingly low. The above three castes which constitute only 35 percent of the total population in the country occupied 65 percent of ministerial posts while only less than 35 percent of ministerial posts have been occupied by remaining 65 percent of the population in the country. The Hill Social Groups which constitute 29 percent of population occupied only 17.4 percent of ministerial posts, and their participation in governance in relation to their proportion in the population is represented by the factor of 0.6 only. Similarly Madhesi of Tarai which constitutes 33 percent of population occupied only 15.3 percent of ministerial posts, and their participation in relation to their proportion of population is the lowest over the period of 55 years as represented by the factor of 0.46 only.
The Prime minister, finance minister and home minister occupy tremendous power in the government. So far from 1951 until present there had been 35 heads of the cabinet. Among those 35, there were 8 Brahmans, 7 Chhetris and 2 Newars. There had been no body from Madhesi and Hill Social Group as yet to become Prime Minister of Nepal. Brahman has been dominating in its representation at the prime minister level. Similarly over the period between 1951 and 2006, there had been 38 finance ministers of Nepal, of which 16 were Brahmans, 15 were Chhetris and 7 were from Newar community. No body from Madhesi and Hill Social Group has yet become finance minister of Nepal. In terms of proportional share index, Newar has been dominating in its representation at the finance minister level.
The women representation in the cabinet over last fifty five years has been extremely low to the level of only 3.3 percent representation in the cabinet. Of this meager representation, Brahmin and Chhetri women have dominated with their representation to the extent of about 80 percent while the remaining castes and ethnic groups have represented only 20 percent in the total number.
As far as the Vice-Chairman of NPC is concerned, over the entire period of 1958 to 2005 (B.S 2014 to 2061), Brahman, Chhetri and Newar clearly overwhelmingly dominated with their representation. Of the total 22 V.Cs, Brahman, Chhetri and Newar accounted for 21 V.C. positions while there was only one V.C. (Dr. Harka Gurung) who represented from the hill social group and none from the Madhesi group. .
The post of Chief Secretary is the highest in the civil service of His Majesty’s government. So far only Brahman, Chhetri and Newar have occupied this post over the period of 55 years (1951 to 2005). Newar has dominated in their representation as compared to Brahman and Chhetri. No Madhesi or Hill Social Groups has yet been in that position of Chief Secretary in the government over the past period of 55 years during the post Rana period in Nepal.
Similarly the post of Governor is the highest level for making monetary policy in the country and guiding the banking sector in the country. So far mainly Brahman, Chhetri and Newar have occupied this post except one from Tarai (Madhesi) group. So far there has been no representation from Hill Social Group in this position. Also the post of Finance Secretary is very important in managing the financial situation of the country So far only Brahman, Chhetri and Newar have occupied this post over the period of 55 years (1951 to 2005). Newar has dominated in their representation as compared to Brahman and Chhetri. No Madhesi or Hill Social Groups has yet been in that position of Finance Secretary in the government.
Conclusion.
The conclusion of the whole analysis is that during the post-Rana period after a major political change in 1951 there has been centralization of power largely within three caste/ethnic groups namely hill Brahmins, Chhetris, and Newars who constitute only 35 percent of population in Nepal. The Madhesi, Hill Social Groups and others who constitute 65 percent of Nepal’s population have largely been left out from the decision and policy making levels in the government and therefore they are deprived of the opportunity to articulate their needs and priorities through government policy in their favour. Thus, due to their exclusion from decision and policy making frameworks, they have remained poor and exploited in the country. The adverse effects of unequal opportunities and political power on development are all the more damaging because the economic, social and political inequalities are reproduced time and again across generations. This leads to what is called “inequity traps”. Highly skewed power structures tend to protect the interests of politically influential and specific privileged caste or ethnic groups, often to the detriment of the majority. This makes society as a whole more inefficient since the excluded groups are not able to exploit their energy, talent and potential Naturally these inequalities must be reduced which would require a positive and progressive frame of mind in the powerful groups to share their power with other deprived groups. What can policymakers do to provide greater inclusion or equity? In order to promote inclusion of the excluded groups, the policy makers must create policies aimed at leveling the economic and political playing field. They include the need to invest in people; make provision for reservation; expand access to justice, physical and economic infrastructure; and promote fairness in employment opportunities and markets. Governments must seek to reverse the usual order of things, starting with the poorest and most excluded castes and ethnic groups.
References:
Risal Bharav /Ram Mani Risal. Nepalka Mantriharu (2007 to 2061B.S.). Jestha 2061 B.S.
NPC, HMG; Short description of the organization of National Planning Commission, Singha Darbar 2040 B.S.
Annex 1
Head of the government
or
Prime Ministers of Nepal
Name Date of Appointment
1. Mohan Shamsher J.B.R. Falgun 7, 2007 February 18, 1951
2. Matrika Pd. Koirala Mansir 1, 2008 November 16, 1951
3. Tanka Pd. Acharya Magh 13, 2012 January 27, 1956
4. Dr. K.I. Singh Shrawan 11, 2014 July 26, 1957
5. Subarna shamsher JBR (Chairman) Jestha 2, 2015 May 15, 1958
Democratic Government
6. Bisheshwar Pd. Koirala Jestha 13, 2016 May 27, 1959
Panchayat Period
7. King Mahendra B.B. Shah Dev (Chairman) Poush 13, 2017 December 27, 1960
8. Dr. Tulsi Giri (Chairman) Chaitra 20, 2019 April 2, 1963
9. Surya Bahadur Thapa (Chairman) Ashadh 2, 2022 June 16, 1965
10. Surya Bahadur Thapa Magh 14, 2023 January 27, 1967
11. Kirtinidhi Bista Chaitra 25, 2025 April 7, 1969
12. Gahendra Bahadur Rajbhandary (Officiating) Chaitra 31, 2026 April 13, 1970
13. Kirtinidhi Bista Baishakh 1, 2028 April 14, 1971
14. Nagendra Pd. Rizal Shrawan 1, 2030 July 16, 1973
15. Dr. Tulsi Giri Mansir 15, 2032 December 1, 1975
16. Kirtinidhi Bista Bhadra 27, 2034 September 12, 1977
17. Surya Bahadur Thapa Jestha 16, 2036 May 30, 1979
18. Lokendra Bahadur Chand Ashadh 29, 2040 July 13, 1983
19. Nagendra Pd. Rizal Chaitra 8, 2042 March 21, 1986
20. Marichman Singh Shrestha Ashaadh 2, 2043 June 16, 1986
21. Lokendra Bahadur Chand Chaitra 24, 2046 April 6, 1990
Democratic Government
22. Krishna pd. Bhattarai Baishakh 6, 2047 April 19, 1990
23. Giriza Pd. Koirala Jeshtha 15, 2048 May 29, 1991
24. Manmohan Adhikary Mansir 14, 2051 November 30, 1994
25. Sher Bahadur Dewba Bhadra 27, 2052 September 12, 1995
26. Lokendra Bahadur Chand Falgun 29, 2053 February 11, 1997
27. Surya Bahadur Thapa Ashoj 21, 2054 October 7, 1997
28. Giriza Pd. Koirala Baisakh 2, 2055 April 15, 1998
29. Krishna Pd. Bhattarai Jestha 17, 2056 May 31, 1999
30. Giriza Pd. Koirala Chaitra 8, 2057 March 21, 2001
31. Sher Bahadur Deuba Shrawan 11, 2058 July 26, 2001
Under Article 127
32. Lokendra Bahadur Chand Ashoj 25, 2059 October 1, 2002
33. Surya Bahadur Thapa Jestha 28, 2060 June 11, 2003
34. Sher Bahadur Deuba Jestha 28, 2061 June 10, 2004
35. King Gyanendra B.B. Shah Dev (Chairman) Magh 19, 2061 February 1, 2005Annex 2
Finance Ministers
Name Appointment Date
Subarna Shamsher JBR Falgun 7, 2007 February 18, 1951
Matrika Prasad Koirala Ashadh 4, 2010 June 17, 1953
S. Gunjaman Singh Magh 3, 2013 January 16, 1957
C.B. Singh Shrawan 11, 2014 July 26, 1957
Subarna S. JBR Jestha 2, 2015 May 15, 1958
Democratic Government
6. Subarna SJB Rana Jeastha 13, 2016 May 27, 1959
Panchayat Period
Rishikesh Shah Poush 13, 2017 December 27, 1960
Surya Bahadur Thapa Ashadh 18, 2019 July 2, 1962
Surendra Bahadur Basnyat Ashwin 10, 2025 September 25, 1968
Kirti Nidhi Bista Chaitra 25, 2025 April 7, 1969
Gahendra Bahadur Rajbhandary Chaitra 31, 2026 April 13, 1970
Kirtinidhi Bista Baisakh 1, 2028 April 14, 1971
Gyanendra Bahadur Karki Shrawan 1, 2030 July 16, 1973
Dr. Bhekha Bahadur Thapa Kartik 15, 2031 October 31, 1974
Dr. Ram Prasad Rajbahak Baisakha 1, 2036 April 14, 1979
Surya Bahadur Thapa Jestha 16, 2036 May 30, 1979
Dr. Yadav Prasad Pant Jestha 19, 2037 June 1, 1980
Dr. Prakash Chandra Lohani Ashardh 29, 2040 July 30, 1983
Bharat Bahadur Pradhan Chaitra 8, 2042 March 21, 1986
Pashupati SJB. Rana Chaitra 24, 2046 April 6, 1990
Democratic Government
Dr. Devendra Raj Panday Baisakha 6, 2047 April 19, 1990
Girija Prasad Koirala Jestha 15, 2048 May 29, 1991
Mahesh Acharya Poush 15, 2048 December 30, 1991
Bharat Mohan Adhikary Mansir 14, 2051 November 30, 1994
Dr. Ram Sharan Mahat Ashoj 6, 2052 September 22, 1995
Rabindra Nath Sharma Falgun 29, 2053 March 12, 1997
Rabindra Nath Sharma Ashoj 21, 2054 October 7, 1997
Dr. Ram Sharan Mahat Baisakha 2, 2055 April 15, 1998
Bharat Mohan Adhikary Poush 10, 2055 December 25, 2998
Mahesh Acharya Jestha 17, 2056 May 31, 1999
Mahesh Acharya Chaitra 8, 2057 March 21, 2001
Dr. Ram Sharan Mahat (in Giriza’s Govt)
Dr. Ram Sharan Mahat (in Deuba’s Gov) Shrawan 11, 2058 July 26, 2001
Under Article 127
Dr. Badri Prasad Shrestha Ashoj 25, 2059 October 11, 2003
Dr. Prakash C. Lohani Jestha 28, 2060 June 11, 2003
Bharat Mohan Adhikary Jestha 28, 2061 June 10, 2004
Madhukar Rana Magh 19, 2061 February 1, 2005
Dr. Roop Jyoti Mansir 22, 2062 December 7, 2005
Annex 3
Name of Home Ministers
Date of Appointment
1. Bisheswar Prasad Koirala Falgun 7, 2007 February 18, 1951
2. Surya Prasad Upadyaya Mansir 1, 2008 November 16, 1951
3. M.J.Mahabir Shamsher JBR Ashoj 4, 2010 September 20, 1953
4. Tanka Prasad Acharya Falgun 7, 2010 February 18, 1954
5. Tanka Prasad Acharya Magh 13, 2013 January 26, 1957
6. Dr. K.I. Singh Shrawan 11, 2014 July 26, 1957
7 Dr. Dilli Raman Regmi Jestha 2, 2015 May 15, 1958
Democratic Government
8. Surya Prasad Upadyaya Jestha 13, 2016 May 27, 1959
Panchayat Period
9. Bishwa Bandhu Thapa Poush 13, 2017 December 27, 1960
10. Karga Bahadur Singh Chaitra 20, 2019 April 2, 1963
11. Dr. Tulsi Giri Chaitra 27, 2020 April 9, 1964
12. Dil Bahadur Thapa Magh 13, 2021 January 26, 1965
13. Surya Bahadur Thapa Ashardh 2, 2022 June 16, 1965
14. Vedananda Jha Shrawan 16, 2023 July 31, 1966
15. Gahendra Bahadur Rajbhandary Jestha 15, 2024 May 29, 1967
16. Nava Raj Subedi Ashwin 10, 2025 September 25, 1968
17. Karga Bahadur Singh Chaitra 25, 2025 April 7, 1969
18. Shalendra Kumar Upadhyaya Chaitra 31, 2026 April 13, 1970
19. Rudra Prasad Giri Baishakha 1, 2028 April 14, 1971
20. Shambhu Prasad Gyawali Bhadra 13, 2028 August 29, 1971
21. Jog Mehar Shretha Baisakha 4, 2029 April 16, 1972
22. Home Bahadur Shrestha Shrawan 1, 2030 July 16, 1973
23. Bhoj Raj Ghimire Mansir 15, 2032 December 1, 1975
24. Kharga Bahadur Singh Bhadra 27, 2034 September 12, 1977
25. Kedar Man Vyathit Baisakha 1, 2036 April 14, 1979
26. Jog Mehar Shretha Jestha 16, 2036 May 30, 1979
27. Nava Raj Subedi Jestha 19, 2037 June 1, 1980
28. Nain Bahadur Swar Ashad 2, 2038 June 16, 1981
29. Padma Sunder Lawti Ashad 29, 2042 July 13, 1985
30. Jog Mehar Shrestha Jestha 1, 2042 May 14, 1985
31. Lila Raj Bista Chaitra 8, 2042 March 21, 1986
32. Prakash Bahadur Singh Ashad 2, 2043 June 16, 1986
33. Niranjan Thapa Falgun 26, 2044 March 9, 1988
34. Nain Bahadur Suwar Chaitra 24, 2046 April 6, 1990
Democratic Government
35. Yog Prasad Upadhaya Baishakh 6, 2047 April 19, 1990
36. Sher Bahadur Deuba Jestha 15, 2048 May 29, 1991
37. K.P. Oli Mansir 14, 2051 November 30, 1994
38. Khum Bahadur Khadka Ashoj 6, 2052 September 22, 1995
39. Govinda Raj Joshi Baisakh 8, 2053 April 20, 1996
40. Bamdeo Gautam Falgun 29, 2053 March 12, 1997
41. Budhi Man Tamang Ashoj 27, 2054 October 13, 1997
42. Khum Bahadur Khadka Mansir 18, 2054 December 3, 1997
43. Krishna Prasad Bhattarai Jestha 17, 2056 May 31, 1999
44. Purna Bahadur Khadka Ashad 16, 2056 June 30, 1999
45. Govinda Raj Joshi Chaitra 8, 2056 March 20, 2000
46. Ram Chandra Poudel
47. Khum Bahadur Khadka Shrawan 11, 2058 July 26, 2001
Under Article 127
48. Dharma Bahadur Thapa Ashoj 25, 2059 October 11, 2002
49. Surya Bahadur Thapa Jestha 28, 2060 June 11, 2003
50. Purna Bahadur Khadka Jestha 28, 2061 June 10, 2004
51. Dan Bahadur Shahi Magh 19, 2061 February 1, 2005
52. Kamal Thapa Mansir 22, 2062 December 7, 2005
Annex 4
Vice-Chairman of National Planning Commission
S. Gunjaman Singh - Planning Commission in 1957 (2013)
J. Kiran Shamsher JBR - Planning Board
Democratic Government
Subarna Shamsher JBR
Dr. Triveni Prasad Pradhan
Panchayat Period
Rishikesh Shah - National Planning Commission
Surya Bahadur Thapa
Shailendra Kumar Upadhyaya
Dr. Harka Bahadur Gurung
Dr. Badri Prasad Shrestha
Dr. Ratna Shamsher JBR
Dr. Mohan Man Sainju
Dr. Bharat Prasad Dhital
Democratic Government
13. Dr. Bharat Prasad Dhital
14. Dr. Devendra Raj Panday
15. Dr. Ram Sharan Mahat
16. Dr.Mangal Sidhi Manadhar
Mr. Prithwi Raj Ligal
18. Dr. Mangal Sidhi Manandhar
19. Dr. Raghab Dhoj Pant (Officiating only)
20. Mr. Prithwi Raj Ligal
21. Dr. Narayan Khadka
Government under Article 127
22. Dr. Shankar Prasad Sharma
Annex 5
Governors of Nepal Rastra Bank
Himalaya Shamsher JBR
Laxmi Nath Gautam
Pradumn Lal Rajbhandary
Dr. Bhekh Bahadur Thapa
Dr. Yadav Prasad Pant
Kul Shekhar Sharma
Kalyan Bikram Adhikary
Ganesh Bahadur Thapa
Democratic Government
Hari Shankar Tripathi
Satyandra Pyara Shrestha
Dr. Tilak Rawal
Dipendra Purush Dhakal
Government under Article 127
Bijaya Nath Bhattarai
Annex 6
Chief Secretaries of HMG
S. Gunjaman Singh---Cabinet Secretary
J. Chandra Bahadur Thapa
Shobhajang Thapa
Kulshekhar Sharma---Chief Secretary
Krishna Bam Malla
Chhetra Bikram Rana
Pradumna Lal Rajbhandary
Krishna Bahadur Manandhar
Bhogendra Nath Rimal
Karna Dwaj Adhikary
Lok Bahadur Shrestha
Democratic Government
Damodar Prasad Gautam
Madhusudan Prasad Gorkhali
Dr. Ishwar Prasad Upadhyaya
Balram Singh Malla
Tirth Man Shakya
Keshab Raj Rajbhandary
Dr. Bimal Prasad Koirala
Government under Article 127
19. Lok Man Singh Karki
Annex 7
Secretaries of Finance
Himalaya Samsher J.B.R.
Nir Raj Bhandary
Ram Prasad Joshi
Democratic Government
Chuda Nanda Baidya
Panchayat Period
Dr. Yadav Prasad Pant
Dr. Bhesh Bahadur Thapa
Bharat Bahadur Pradhan
Narkant Adhikary
Dr. Devendra Raj Panday
Goraksa Bahadur Nehunche Pradhan
Karnadhwaj Adhikary
Lok Bahadur Shrestha
Dr. Shashi Narayan Shah
Democratic Government
Dr. Thakur Nath Pant
Ram Binod Bhattarai
Dr. Bimal Prasad Koirala
Bhanu Prasad Acharya
Annex 8
Name of Women Minister, State Minister and Assistant Minister
Democratic Period
1. Dwarikadevi Thakurani Assistant Minister Jesth 13, 2016 May 27, 1959
King’s Government
2. Mrs. Kamal Shah Assistant Minister Baishakh 4, 2029 April 6, 1972
3. Mrs. Kamal Shah State Minister Shrawan 1, 2030 July 16, 1973
4. Mrs. Shushila Thapa Assist. Minister Chaitra 16, 2030 Mar. 29, 1974
5. Mrs. Shushila Thapa Assist. Minister Kartic 15, 2031 Oct. 31, 1974
6. Mrs. Shushila Thapa State Minister Mansir 15, 2032 Dec. 1, 1975
7. Mrs. Saraswati Rai Assist. Minister Bhadra 27, 2035 Sept. 12, 1978
8. Mrs. Kalpana Bista Assist. Minister Jestha 16, 2036 May 30, 1979
9. Mrs. Saraswati Rai Assist. Minister Jestha 19, 2037 June 1, 1980
10. Miss Bhadra Kumari Ghale State Minister Ashad 2, 2038 June 16, 1981
11. Mrs. Bidyadevi Devekota Assist. Minister Ashad 29, 2040 July 13, 1983
12. Mrs. Bidyadevi Devekota Assist. Minister Ashwin 1, 2041 July 16, 1984
13. Miss Chanda Shah Assist. Minister Ashad 2, 2043 June 15, 1986
14. Ms. Chanda Shah Assist. Minister Falgun 26, 2044 Mar. 9, 1988
15. Mrs. Shushila Thapa Minister Kartic 15, 2045 Oct. 31, 1988
16. Mrs. Shushila Thapa Minister Bhadra 14, 2046 Aug. 30, 1989
17. Mrs. Shushila Thapa Minister Chaitra 19, 2046 Apr. 1, 1990
Democratic Government
18. Miss. Shailaja Acharya Minister Jestha 15, 2048 May 29, 1991
19 Miss. Shailaja Acharya Minister Poush 15, 2048 Dec. 30, 1991
20 Mrs. Leela Koirala Minister Mansir 27, 2052 Dec. 13, 1995
21. Mrs. Leela Koirala Minister Poush 24, 2053 Jan. 8, 1997
22. Mrs. Sadhana Pradhan Minister Falgun 29, 2053 Mar. 12, 1997
23. Mrs. Bidyadevi Bhandary Minister Chaitra 12, 2053 Mar. 25, 1997
24. Mrs. Meena Panday State Minister Mansir 18, 2054 Dec. 3, 1997
25. Miss. Shailaja Acharya Dpt Prime Minister Baisakh 8, 2055 Apr. 21, 1998
26. Mrs. Meena Panday State Minister Baisakh 8, 2055 Apr. 21, 1998
27. Mrs. Kamala Pant Assist. Minister Baisakha 8, 2055 Apr. 21, 1998
28. Mrs. Sailaja Acharya Dpt Prime Minister Bhadra 11, 2055 Aug. 28, 1998
29 Mrs.Meena Pandey State Minister Bhadra 11, 2055 Aug. 28, 1998
30 Mrs. Kamala Pant State Minister Asard 16, 2056 June 30, 1999
31 Mrs. Kamala Pant State Minister Chaitra 8, 2056 Mar. 21, 2000
32. Mrs. Kamala Pant State Minister -
33. Mrs. Kamala Pant State Minister
34. Miss. Shushila Suwar State Minister Kartic 2, 2058 Oct. 18, 2001
35. Mrs. Sabitri Bogati (Pathak) Assist. Minister Kartic 2, 2058 Oct. 18, 2001
King’s Government
36. Mrs. Anuradha Koirala Assist. Minister Ashoj 25, 2059 Oct. 11, 2002
37. Mrs. Renu Kumari Yadav State Minister Jestha 28, 2060 June 11, 2003
38. Mrs, Astha Laxmi Shakya Minister Ashad 20, 2061 July 4, 2004
39. Mrs. Pratibha Rana State Minister Ashad 20, 2061 July 4, 2004
40. Ms. Bhim K. Budha Magar Assist. Minister Ashad 20, 2061 July 4, 2004
41. Mrs. Durga Shretha State Minister Magh 19, 2061 Feb 1, 2005
42. Mrs. Yangkila Sherpa State Minister Mansir 22, 2062 Dec. 7, 2005
43. Mrs. Durga Pokharel State Minister Mansir 22, 2062 Dec. 7, 2005
44. Ms. Roshan Karki Assist.Minister Mansir 22, 2062 Dec. 7, 2005
May 21,2001.
Analysis of Caste/Ethnicity Situation in Nepal.
Nepal is a multiethnic and multi-lingual country. It is believed that three caste or ethnic groups which constitute 36.0 percent of population in the country have enjoyed significantly higher level of living as compared the rest of population which constitute about 64.0 percent of population. The challenge today is how to raise the living standard of this 64.0 percent of population to be close to the 36.0 percent of population in the country. This inequity is the major issue in Nepal’s development and this must be addressed soon in order to make Nepal an equitable, sustainable and prosperous country. Table one indicates that Brahman, Chhetri and Newar constitute 36.0 percent of the population. Madhesi (including Madheshi Dalits and Madhesi Adibasi/Janjati) and Hill Social Groups ( hill/mountain Adibasi/Janjati and Dalits) constitute 32.5 and 30.2 percent of the total population respectively.
Table1 :Population by Caste/Ethenicity,2001
Caste/Ethenicity Total Population Percent
Brahman 2896477 12.7
Chhetri 4126743 18.1
Newar 1245232 5.5
Total 8268452 36.3
Madhesi 7381647 32.5
HSG 6855194 30.2
Others 231641 1.0
Total 14468482 63.7
Grand Total 22736934 100.0
Source : Population Census 2001.
Kinds of House Occupied:
The 2001 Census provides some information on the living conditions of the people. Such information includes kind of housing occupied, availability of amenities such as toilet and lighting facilities in the house and the kind of cooking fuel used in the house. As far as types of housing unit, they are classified in three categories, Pakki, semi-Pakki and Kachi houses. Pakki houses were defined as all wall and roofs cement mortar baked brick/stone structures and with tiles/slate/asbestos/corrugated sheet roofs with cement/concrete joints. Kachi houses were defined as mud walls, bamboo and other
Structures of similar materials with Kachi roofs-non corrugated tin cuttings, plastics, straw/khar and other non-lasting materials. Semi- Pakki houses included Kachi structures with Pakki roofs or Pakki structures with Kachi roofs. As per the table 2, almost 69 percent of Newar and 59 percent of Brahman households occupied Pakki structures, whereas only 20.7 percent of Madhesi households occupied Pakki structure. About 29.5 percent of Hill Social Groups had occupied Pakki structure. Data on Kachhi housing, reflecting poor living condition indicate that about 55 percent of
Table2: Households by Types of housing unit in use and caste/ethnicity, Nepal 2001
(in percentage)
Caste/Ethnicity All Types Pakki Semi-Pakki Kachhi Others
Brahmin 100.0 59.0 25.4 15.2 0.4
Chhetri 100.0 46.8 33.1 20.0 0.4
Newar 100.0 69.0 19.6 11.1 0.3
Total 100.0 54.5 28.3 16.8 0.4
Madhesi 100.0 20.7 23.2 55.0 1.1
HSG 100.0 29.5 36.1 33.5 0.9
Others 100.0 32.4 21.6 45.2 0.9
Total 100.0 25.3 29.7 43.9 1.0
Grand Total 100.0 36.6 29.2 33.5 0.7
Madhesi households and about 33 percent of HSG households occupied Kachi structure as compared to only 11 percent of Newar households, 15 percent of Brahman and 20 percent of Chhetri households. This table clearly indicates the living quarters of Madhesi were relatively of lower quality as compared to others in the country.
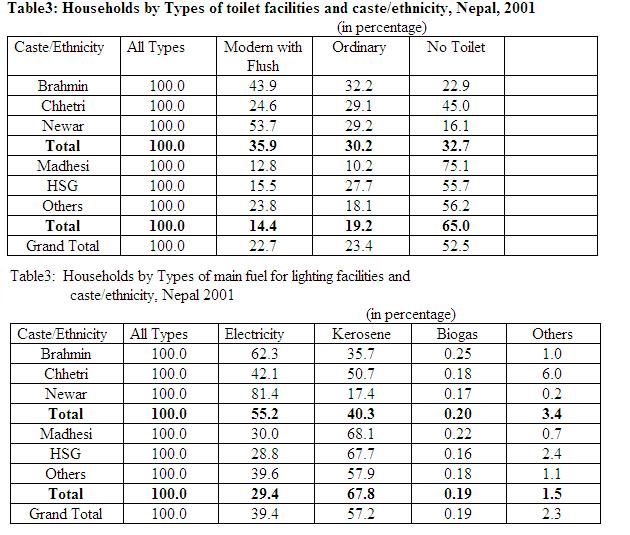
Sanitation Facilities
It is generally believed that modern flush toilet facilities in houses reflect better sanitation facilities in the households. Overall only 23 percent of the households were reported to have toilets with such facility in the country.
Table3: Households by Types of toilet facilities and caste/ethnicity, Nepal, 2001
(in percentage)
Caste/Ethnicity All Types Modern with Flush Ordinary No Toilet
Brahmin 100.0 43.9 32.2 22.9
Chhetri 100.0 24.6 29.1 45.0
Newar 100.0 53.7 29.2 16.1
Total 100.0 35.9 30.2 32.7
Madhesi 100.0 12.8 10.2 75.1
HSG 100.0 15.5 27.7 55.7
Others 100.0 23.8 18.1 56.2
Total 100.0 14.4 19.2 65.0
Grand Total 100.0 22.7 23.4 52.5
Table 3 indicates that about 54 percent of Newar households, 44 percent of Brahmn and 25 percent of Chhetri households have modern toilet with flush as compared to only about 13 percent of Madhesi and 15 percent of HSG households who have such facility. It is pitiable to note that 75 percent of Madhesi households are without toilet facility in their house. The hill social group is relatively better off than the Madhesi group in this regard, however almost 56 percent of HSG have no toilet facility.
Lighting Facilities
As we combine electricity with biogas, the table 3 indicates that overall only 40 percent of the households had electricity/biogas lighting facilities and 57 percent used kerosene in the country. About 81.6 percent of Newar households use electricity for lighting while
Table3: Households by Types of main fuel for lighting facilities and
caste/ethnicity, Nepal 2001
(in percentage)
Caste/Ethnicity All Types Electricity Kerosene Biogas Others
Brahmin 100.0 62.3 35.7 0.25 1.0
Chhetri 100.0 42.1 50.7 0.18 6.0
Newar 100.0 81.4 17.4 0.17 0.2
Total 100.0 55.2 40.3 0.20 3.4
Madhesi 100.0 30.0 68.1 0.22 0.7
HSG 100.0 28.8 67.7 0.16 2.4
Others 100.0 39.6 57.9 0.18 1.1
Total 100.0 29.4 67.8 0.19 1.5
Grand Total 100.0 39.4 57.2 0.19 2.3
only about 30 percent of Madhesi and Hill Social Group use electricity for lighting. About 68 percent of Madhesi and HSG use kerosene for lighting in the house. Since most of them live in rural areas and so they have not have yet the access of electricity. About 62.5 percent of Brahman households use electricity/biogas for lighting.
Kinds of Cooking Fuel Used
Wood is still the main fuel used for cooking by all households irrespective of ethnicity and caste. Table 4 indicates that in 2001, overall, nearly 66 percent of the households used wood for cooking. Generally much of the households in the hills depended on wood for cooking. Among them overwhelming proportion of households of Hill Social Groups and Chetri used wood for cooking. Madhesi households still depend on Goitha (dried cowdung) for cooking. About 31 pecent of Madhesi household depend on Goitha. Only minority of households used LPgas/biogas. Wood and kerosene constitute the main fuel used for cooking in Nepal yet. Thus we still depend heavily on traditional source of fuel for cooking. Cooking on Lp gas is luxury in Nepal. About 22percent of Newar and 18 percent of Brahman households use Lp gas in Nepal. Less than 5 percent of Madhesi and HSG use Lpand Biogas for cooking.
Table 4:Households by type of main fuel used for cooking and caste/ethnicity, Nepal 2001
Percentage of Households
Caste/Ethnicity Total Wood Kerosene Wood& Kerosene Lp Gas Bio Gas Lpgas &Biogas Goitha
Brahman 100.0 56.0 18.4 74.4 18.2 5.2 23.4 0.9
Chhetri 100.0 75.0 13.2 88.2 7.5 2.3 9.8 0.8
Newar 100.0 37.3 33.2 70.5 22.0 1.3 23.3 1.1
Total 100.0 62.5 18.0 80.5 13.5 3.2 16.7 0.9
Madhesi 100.0 53.2 10.3 63.6 3.4 0.5 3.9 30.6
HSG 100.0 81.1 10.9 92.0 4.4 0.9 5.3 1.8
Others 100.0 60.4 15.0 75.4 9.0 1.0 10.0 12.6
Total 100.0 67.5 10.7 78.2 4.0 0.7 4.7 15.7
Grand Total 100.0 65.6 13.5 79.1 7.7 1.6 9.3 10.0
After reviewing the living conditions of the various caste/ethnic groups, we find that Madhesi lies in the bottom while Newar and Brahman lie on the top of the spectrum. Hill Social Groups constituting Adibasi/Janjati and hill Dalits are relatively better off than Madhesi but fall much below to Brahman and Newar group.
Educational Attainment and Occupational Opportunities by Caste/Ethnicity.
Here we examine information on individual access to literacy, education and employment opportunities for various groups of the population.
Literacy and Educational Attainments
Literacy is, beyond doubt, primary index of educational development. The 2001 census has defined literacy as an ability to read and write in any language with understanding and to do simple arithmetic calculations. Literacy is thus understood as the acquisition of reading, writing and simple numeric skills. Table 5 indicates that in 2001 only about 54 percent of the population of six years and above was literate.
Table 5: Total and Literate Population (both sexes) of 6 years of age and above by Literacy rate , Educational attainment, Caste/Ethnicity & Sex, Nepal, 2001
(in percentage)
Caste/Ethnicity All Types Literacy Rate SLC & Above Graduate & Above
Brahmin 100.0 75.6 23.7 5.7
Chhetri 100.0 60.9 10.7 1.8
Newar 100.0 72.2 20.3 4.2
Total 100.0 67.9 16.8 3.6
Madhesi 100.0 40.7 3.0 0.5
HSG 100.0 49.8 3.8 0.4
Others 100.0 50.0 9.6 2.5
Total 100.0 45.2 5.0 0.8
Grand Total 100.0 53.7 9.4 1.8
Literacy rate varied widely among various caste/ethnic groups. While about 76 percent of Brahman and 72 percent of Newar were literate, only 40.7 percent of Madhesi had literacy skill (So far only 21 percent of the Madhesi Dalits had been literate). One of the main factors in this lag was low female literacy (see tables 6 and 7). In Table 7, under Madhesi group female education (the figures in bracket) were derived after deducting the figures of Madhesh Brahman and Kayasta group, which indicates relatively very low.
Madhesi and Hill Social Groups are greatly disadvantaged in terms of education. The above table indicates that only 3.0 percent of Madhesi and 3.8 percent of HSG had education upto SLC and above while 23.7 percent of Brahman and 20.3 percent of Newar had education upto SLC and above. In higher education at the level of graduate and above it is clearly dominated by Brahman and Newar group followed by Chetri group. Table 5 indicated that only 0.5 percent of Madhesi and 0.4 percent of HSG had education upto Graduate and above level as compared to 5.7 percent of Brahman and 4.2 percent of Newar. The representation of Madhesi and Hill Social Groups is extremely limited at higher level of government policy and administrative level, largely due to limited number of graduates in these groups. So the first thing that needs to be done is to increase their number for that level of education. Though HSG indicates higher level of literacy rate as compared to Madhesi group but at higher level of education Madhesi has performed better than HSG as far as male population is concerned see table 6.
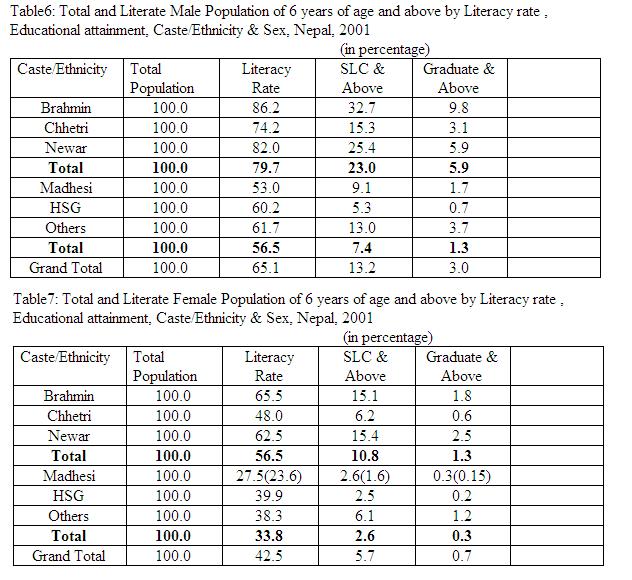
Table6: Total and Literate Male Population of 6 years of age and above by Literacy rate , Educational attainment, Caste/Ethnicity & Sex, Nepal, 2001
(in percentage)
Caste/Ethnicity Total Population Literacy Rate SLC & Above Graduate & Above
Brahmin 100.0 86.2 32.7 9.8
Chhetri 100.0 74.2 15.3 3.1
Newar 100.0 82.0 25.4 5.9
Total 100.0 79.7 23.0 5.9
Madhesi 100.0 53.0 9.1 1.7
HSG 100.0 60.2 5.3 0.7
Others 100.0 61.7 13.0 3.7
Total 100.0 56.5 7.4 1.3
Grand Total 100.0 65.1 13.2 3.0
Table7: Total and Literate Female Population of 6 years of age and above by Literacy rate , Educational attainment, Caste/Ethnicity & Sex, Nepal, 2001
(in percentage)
Caste/Ethnicity Total Population Literacy Rate SLC & Above Graduate & Above
Brahmin 100.0 65.5 15.1 1.8
Chhetri 100.0 48.0 6.2 0.6
Newar 100.0 62.5 15.4 2.5
Total 100.0 56.5 10.8 1.3
Madhesi 100.0 27.5(23.6) 2.6(1.6) 0.3(0.15)
HSG 100.0 39.9 2.5 0.2
Others 100.0 38.3 6.1 1.2
Total 100.0 33.8 2.6 0.3
Grand Total 100.0 42.5 5.7 0.7
The performance of both Madhesi and HSG is at disappointment level as far as female education is concerned. Table 7 clearly shows that this is one very critical area that needs to be addressed soon with urgency. The literacy level of Madhesi female population is just half (27 % ) as compared to Madhesi male population (53%) At higher level, the difference is many fold between these two. Similarly, the literacy level of HSG female population is 40 percent as compared to HSG male population of 60 percent.. At higher level, the difference is many fold between these two.
Table8 indicates that Brahman, Chhetri, and Newar together constitute almost two-third of SLC and Above and three-fourth of graduates and above in the country and on the contrary Madhesi and HSG constitute only one-third of SLC and Above and one-fourth of Graduates and above. With this large gap, it is likely to have greater representation of Braman ,Chetri and Newar in most of the white color job in the country.
Table8: Total and Literate Population (both sexes)of 6 years of age and above by Literacy rate , Educational attainment, Caste/Ethnicity & Sex, Nepal, 2001
(in percentage)
Caste/Ethnicity Total Population Total Literate SLC & Above Graduate & Above
Brahmin 13.4 18.8 33.6 41.5
Chhetri 18.3 20.8 20.7 18.2
Newar 5.9 7.9 12.6 13.5
Total 37.6 47.5 66.9 73.2
Madhesi 31.4 23.8 19.8 18.3
HSG 30.0 27.8 12.3 7.1
Others 1.0 0.9 1.0 1.4
Total 62.4 52.5 33.1 26.8
Grand Total 100.0 100.0 100.0 100.0
Employment in white color job
Table9 indicates that more than 70 percent of jobs in legislation, administration, profession and technicians groups and 62 percent of job in Clerical group are occupied by Brahman, Chetri and Newar in the county. So clearly the white color jobs are largely taken by BCN which constitute about 40 percent of population while 60 percent of population share only less than one-third of such jobs.
Table9: Employed population (both sexes)of 10 years of age and over by caste/ethnicity, 2001
(in percentage)
Caste/Ethnicity Total Population Legislator &Administrator Professional Technician Clerical
Brahmin 13.4 33.5 36.0 24.7
Chhetri 20.1 19.4 21.0 25.1
Newar 7.4 20.0 13.5 12.6
Total 40.9 72.9 70.5 62.4
Madhesi 27.1 14.0 (8.6)* 16.7 (11.4)* 20.3 (16.6)*
HSG 31.2 12.0 12.0 16.3
Others 0.9 1.1 0.8 1.0
Total 59.1 27.1 29.5 37.6
Grand Total 100.0 100.0 100.0 100.0
* Figures in bracket represents after deducting the data for Madhesi Brahman and Kayasta group.
The above data clearly indicate that, Brahman, Chhetri and Newar mostly control the allocation of state resources and policy decisions. Others Madhesi, and Hill social groups are deprived to a considerable extent of the opportunities of employment in higher position of government services. This can be attributed to both their limited access to higher education and also traditionally exclusionary and discriminatory state norms, values and practices. This is also the conclusion of study on “ Analysis of Caste, Ethnicity and Gender Data from 2001 Population Census in Preparation for Povery Mapping and Wider PRSP Monitoring, p.60”.
[ Data used for this study mainly came from the Annexes of “Analysis of Caste, Ethnicity and Gender Data from 2001 Population Census in Preparation for povery Mapping and Wider PRSP Monitoring: Annexes, Reference Contract 96-03/04-167-542-028-CW-018, February 21, 2005; Submitted to DFID by Tanka Prasad Acharya Memorial Foundation, Naxal Bhagawati Bahal, Kathmandu.]
No comments:
Post a Comment